
Note: see here for a collection of links to Sim-cM-related pages.
When we find a DNA match between two people, one way we can attempt to understand their relationship is to evaluate the amount of DNA shared. Resources such as The Shared cM Project, and DNA Painter’s relationship probability tool allow us to quickly evaluate the likelihood of different relationships for a pair of relatives based on their amount of shared DNA. For additional ways of looking at DNA shared between matches (including data for some less common relationships not represented in the Shared cM Project), my Sim-cM dataset can give some insight using results from simulated relationships.
One aspect of DNA sharing not detailed in these resources, though, is the sharing of DNA in fully identical regions (FIRs). A fully identical region between two DNA testers is one in which the two individuals have matching segments on both their maternal and paternal chromosomes; see the ISOGG wiki for more. FIRs are not obvious in much of the DNA sharing information reported by testing companies; in most cases, shared DNA segments are counted just once toward the total regardless of whether they match on one or both chromosomes.1 23andMe is an exception to this, counting FIRs twice, and counting the half identical regions (HIRs) once. Also, FIRs can be visualized between matches using the One-to-One comparisons at GEDmatch.
But what can we do with FIRs?
FIRs only arise when both testers have matching segments inherited from their mothers and from their fathers. Thus, any DNA matches with true FIRs (and not just some testing artifact that looks like a FIR) would be related to each other through both of their parents. One of the most obvious examples is full siblings. Since full siblings have the same father and the same mother, they have DNA in common with each other from both parents, and some of this will end up in FIRs, where two siblings both got the same segment from their mom and the same segment from their dad in the same location. Half siblings, though, only share one parent, so (unless they’re related in some additional way) they should have no FIRs. AncestryDNA uses this behind the scenes to help distinguish relationships.2 Kitty Cooper has discussed using FIRs to distinguish full siblings and half siblings, with some additional notes on ¾ siblings and double first cousins,3 and she has also examined FIRs for clues about unexpected levels of relatedness.4
Theoretical calculations tell us that full siblings should have fully identical regions of DNA with one another for about a quarter of their genomes (about 850cM), on average, and that double first cousins will share fully identical DNA with each other across about 1.6% of their genomes (about 106.25 cM), on average.5 But what about other relationships? What about people who aren’t average?
Enter simulated data. In the Sim-cM data analysis I’ve published so far, I ignored the FIRs, calculating shared DNA totals (and segment sizes) using any segments that were at least half-identical, similar to much of the data reported by testing companies (see the Sim-cM White Paper for more details). But the simulated pedigrees I generated did have FIRs for some relationships, and now I’ve taken a closer look at these segments.6
Siblings: Full siblings, ¾ siblings, half siblings
As shown in Sim-cM data, full siblings, ¾ siblings, and half siblings are expected to share different total amounts of DNA – on average, 2490cM, 2060cM, and 1651cM, respectively. Figure 1 shows the distributions of expected amounts of total DNA shared for these relationships and illustrates that while the average amounts shared differ, there is overlap between them. For example, if two people share 2300 cM, simulations suggest they could be either full siblings or ¾ siblings, though they are unlikely to be half siblings. Or if they share 1900cM, they could be ¾ or half siblings, but likely not full siblings.

FIRs can be one way to distinguish these relationships. Since half siblings are only related through one of their parents, they share no FIRs (unless there is additional unexpected relatedness through their unshared parent). Thus, if two matches share no FIRs, they are most likely not full or ¾ siblings, but possibly half siblings. So what about full and ¾ siblings?
Figure 2 shows the amounts of DNA in FIRs shared by full siblings and by ¾ siblings. In the simulated pedigrees, 100% of full siblings and 100% of ¾ siblings shared at least one FIR (out of 10,000 simulations per relationship). On average (once segments < 7cM were removed), full siblings had 807 cM in FIRs,7 whereas ¾ siblings had 385 cM in FIRs. Since full siblings share more total DNA than ¾ siblings on average, it is not surprising that they would also have more FIRs – amount of DNA in FIRs is correlated with total amount shared of DNA.
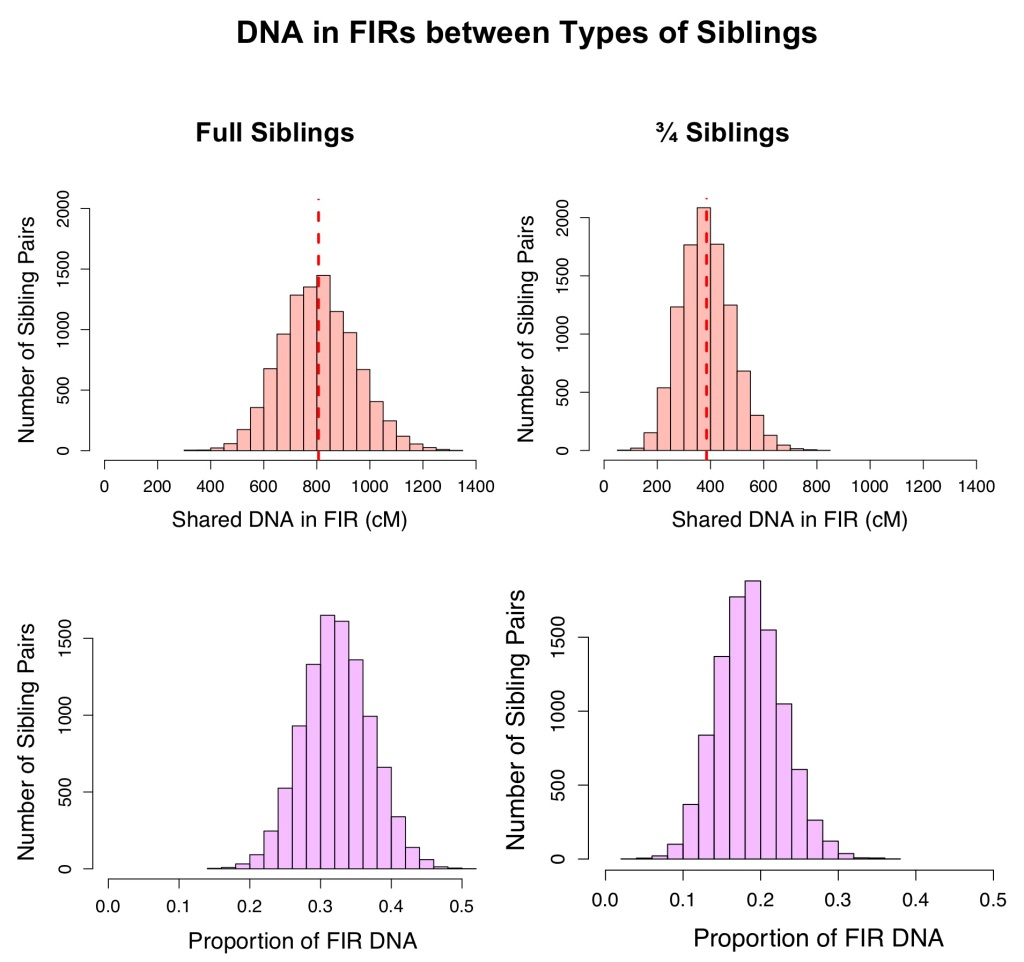
Proportion = (FIR length/Total Shared DNA). FIR length was only counted once per segment for these calculations.
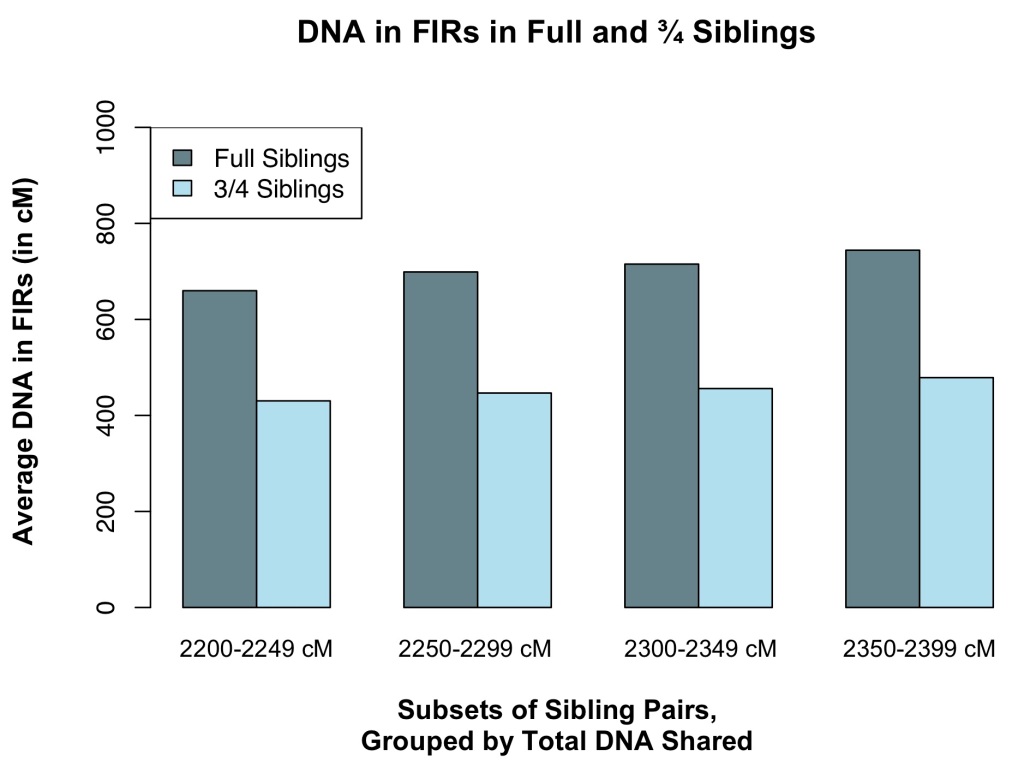
Even among sibling pairs sharing roughly the same amount of total DNA, full siblings had more DNA in FIRs than did ¾ siblings, on average (see Figure 3). So, if two siblings share enough DNA to be either full siblings or ¾ siblings, full siblings might share more DNA in FIRs than ¾ siblings would.
Amounts of DNA in FIRs shared in a set of four real-life full siblings are consistent with the plots shown in Figure 2. See Table 1 for amounts of shared DNA in FIRs and amounts of total DNA shared between pairs of siblings in the set (where siblings are labeled “A” through “D”). This range of DNA in FIRs between 628 and 1111 cM equates to proportions of the total length of DNA shared between 0.22 and 0.38.

Double first cousins (2x1C) and 1.5 times first cousins (1.5x1C)
Simulations show that 100% of 2x1C and 99.35% of 1.5x1C shared FIRs, with an average of 184cM for 2x1C and 93 cM for 1.5x1C in FIRs (see Figure 4). The average length of DNA in FIRs in 2x1C is higher than expected according to the ISOGG wiki.8 With little empirical data available to compare to the simulated data, it is difficult to know which of these estimates is closer to what may occur in real life DNA testers.

Double second cousins (2x2C)
How much DNA is shared in FIRs between 2x2C depends on the exact relationship between the 2x2C. Relatives can be double second cousins if they are each the child of a pair of double first cousins (2x1C). But they can also be double second cousins if each parent of each cousin is a first cousin to a parent of the other. Figure 5 illustrates these two pedigrees. The cousins of the first type only share DNA through one of each of their parents, therefore they cannot have any FIRs (without being related to each other in some additional way). The cousins of the second type, however, share DNA with each other through both maternal and paternal sides. While not all 2x2C in these simulated relationships shared FIRs, 49.15% of the cousin pairs did share at least one FIR, with about 21 cM in FIRs on average.

Other types of relationship not discussed here may also share FIRs, including some relatives who are unexpectedly related through both their paternal and maternal sides.
Raw data for the FIRs shared between relatives in the 10,000 simulations for each relationship are available here.
Updated 5 December 2019 – axis limits in Figures 2 and 4 were changed to be more consistent in within each figure.
1. See, for example “Autosomal DNA statistics,” International Society of Genetic Genealogy Wiki, updated 3 September 2018 (https://isogg.org/wiki/Autosomal_DNA_statistics : accessed 4 December 2019), “Distribution of shared DNA for given relationships.” Also, Kitty Cooper, “Why don’t we share more DNA with a Sibling?” Kitty Cooper’s Blog, 20 October 2019 (https://blog.kittycooper.com/2019/10/why-dont-we-share-more-dna-with-a-sibling/ : accessed 4 December 2019).
2. Leah Larkin, “AncestryDNA Is Using FIRs to Distinguish Full and Half Siblings,” The DNA Geek, 7 February 2019 (https://thednageek.com/ancestrydna-is-using-firs-to-distinguish-full-and-half-siblings/ : accessed 4 December 2019).
3. Kitty Cooper, “Full versus Half Sibling DNA Matches,” Kitty Cooper’s Blog, 29 April 2016 (https://blog.kittycooper.com/2016/04/full-versus-half-sibling-dna-matches/ : accessed 4 December 2019). See comments on the post for notes on FIRs in ¾ siblings.
4. Kitty Cooper, “An unusual relationship shown in DNA,” Kitty Cooper’s Blog, 14 August 2017 (https://blog.kittycooper.com/2017/08/an-unusual-relationship-shown-in-dna/ : accessed 4 December 2019).
5. “Autosomal DNA statistics,” International Society of Genetic Genealogy Wiki, updated 3 September 2018 (https://isogg.org/wiki/Autosomal_DNA_statistics : accessed 4 December 2019), “Average autosomal DNA shared by pairs of relatives, in percentages and centiMorgans” table.
6. For FIR analysis, only regions at least 7cM were included; this was the same cutoff used for Sim-cM analyses of total DNA shared since small shared segments, at least in real-life data, could be due to artifacts.
7. The 807cM in FIRs between full siblings is somewhat less than the 850cM predicted per the ISOGG wiki. This could be as a result of FIRs < 7cM being filtered out, or slight differences between the simulated data and data generated by the DNA testing companies; see further discussion in the Sim-cM White Paper.
8. “Autosomal DNA statistics,” International Society of Genetic Genealogy Wiki, updated 3 September 2018 (https://isogg.org/wiki/Autosomal_DNA_statistics : accessed 4 December 2019), “Average autosomal DNA shared by pairs of relatives, in percentages and centiMorgans” table.

Leave a comment