Note: see here for a collection of links to Sim-cM-related pages.
I have recently set up and expanded Sim-cM, a project aimed to supplement The Shared cM Project as a resource for evaluating DNA evidence. Sim-cM uses simulated pedigree data to provide additional information to help us understand the DNA shared between relatives in genetic genealogy research. I have posted averages, ranges, and distributions for total DNA shared, number of segments shared, and size of largest segment shared, along with percent of relatives who share DNA for 70 different relationships (so far). Raw data files are also available for those interested.
So, what should we do with these results?
I first decided to simulate shared DNA data when research into a DNA match suggested a relationship that was not included in the Shared cM Project. So, my simulations in Sim-cM include relationships too rare to show up in The Shared cM Project, as well as those that appear in low numbers. Sim-cM also includes some additional information about all simulated relationships. I’ve come up with a few examples of how we might be able to use Sim-cM results.
Example #1: Evaluating a close match more thoroughly
A tester and their known 1C1R share 286cM across 19 segments at AncestryDNA, which predicts that they are about 2nd or 3rdcousins. The Shared cM Project tool at DNA Painter predicts possible relationships:1
- Half GG-Aunt/Uncle/Niece/Nephew, 2C, Half 1C1R, or 1C2R – 59%
- GG-Aunt/Uncle/Niece/Nephew, Half Great Aunt/Uncle/Niece/Nephew, Half 1C, or 1C1R – 26%
- 1C3R, Half 2C, 2C1R, Half 1C2R – 15%
These predictions are consistent with the known relationship (1C1R), but what if this match was not a known cousin?
Using Sim-cM, we can take a closer look, just considering the results from AncestryDNA. First, we can examine the histograms showing distributions of total amounts of DNA shared – from both Sim-cM and The Shared cM Project.2 See Figure 1 below.

Consistent with the The Shared cM Project tool, based on 286 cM shared between the two testers, the plots in Figure 1 show that it seems fairly likely that they could be 2C (or another relationship in that group), or perhaps 1C1R (or another in that group). The group of relationships including 2C1R appears less likely, but not impossible. With Sim-cM data, however, we can also look at distributions of number of segments shared for different relationships.

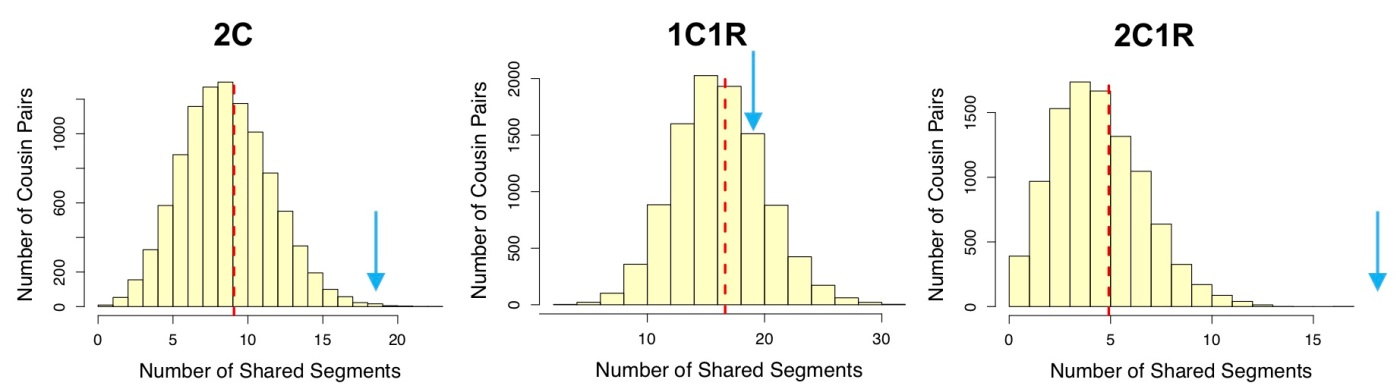
Figure 2. Distributions of number of segments shared for representative relationships in each group from Sim-cM. Arrows in blue show the approximate location of 19 segments on each plot. Other relationships in each group have very similar distributions from Sim-cM. Note that in the third group (2C1R, 1C3R, Half 2C, and Half 1C2R), none of the simulated relative pairs shared as many as 19 segments, out of 10,000 simulations for each relationship. Click to enlarge.
When considering segment count data, the middle group (that containing 1C1R) looks a lot more likely than either of the other two groups.
One caveat here: very little empirical data have been collected so far regarding number of segments shared by people in different relationships,3 so it is difficult to tell how closely the simulated segment count data correspond to that generated by the DNA testing companies. In this particular case, the two testers also have DNA results at Family Tree DNA and at My Heritage. They share 282cM across 16 segments at the former (excluding all segments <7cM), and they share 311 cM across 18 segments at the latter. With any of these results, the resulting conclusions would be similar, giving us a bit more confidence.
And of course, just because shared DNA between two testers leads to a suggestion of a most likely set of relationships, that is really just providing us with a hypothesis (or hypotheses) to be further evaluated:
- We could use the What are the Odds? (WATO) tool to incorporate results from multiple matches and test relationship hypotheses.
- We need to evaluate all of the DNA evidence in the context of documentary evidence before we can come to a conclusion.
Example #2: Looking at a double cousin relationship.
Four siblings share DNA at AncestryDNA with someone suspected to be their double second cousin (i.e. they share two sets of great grandparents with this match). Theoretically, we would expect double second cousins to share, on average, about 425 cM;4 or about twice that of second cousins, which is 466 cM according to the Shared cM Project.5 But what does the distribution of shared DNA look like for double second cousins? The four siblings share with the match:
- 530 cM across 29 segments
- 542 cM across 33 segments
- 387 cM across 24 segments
- 466 cM across 31 segments
What range of shared DNA is reasonable for a double second cousin (2x2C) relationship?

Figure 3 shows that both total shared DNA and number of segments shared between the four siblings and their possible 2x2C fall within the ranges for the relationship generated by Sim-cM. The number of segments shared are on the high side of the distribution. These siblings and the cousin also have DNA results on GEDmatch, though; according to GEDmatch, the siblings share 28, 26, 25, and 27 segments with the match, respectively. Considering the numbers of shared segments called from both AncestryDNA and GEDmatch, the match does appear to fall in the range of a 2x2C with these four siblings.
Once again, more evidence and analysis are needed to prove this relationship, but it’s nice to be able to say that the current hypothesis is a reasonable one give the amount of DNA shared.
Example #3: What about a double second cousin once removed? Or could it be a 1.5 times second cousin once removed?
A person on Family Tree DNA shares DNA with a possible double second cousin once removed (2x2C1R). Filtering out small segments (<7cM), the two testers share 113cM across 7 segments. Is this reasonable for a 2x2C1R?

Looking at the Sim-cM results for 2x2C1R (Figure 4) shows that, yes, the two testers do share a reasonable amount of DNA for 2x2C1R. But one of their suggested shared male ancestors had two wives. If the two cousins descended from different wives, they could be 1.5x2C1R instead? Is the DNA shared consistent with this hypothesis?

Figure 5 shows us that 1.5x2C1R is also a reasonable hypothesis for these two testers – just based on this shared DNA data. We still need to consider DNA shared between these two testers and other matches to clarify all of their shared ancestors, and of course, correlate any DNA-based hypothesis with other evidence.
These are just a few examples of how simulated data from Sim-cM, in addition to results from The Shared cM Project (and other tools), can help us to understand the results we get from DNA testing. I’d love to hear thoughts on other ways that the Sim-cM results can be used.
1. “The Shared cM Project 3.0 tool v4,” DNA Painter (https://dnapainter.com/tools/sharedcmv4 : accessed 10 October 2019), for a total of 286 cM.
2. Blaine T. Bettinger, “The Shared cM Project – Version 3.0 (August 2017),” The Genetic Genealogist (https://thegeneticgenealogist.com/wp-content/uploads/2017/08/Shared_cM_Project_2017.pdf : accessed 10 October 2019), Table 2. Relationship Histograms.
3. Erin Hill-Burns, “Sim-cM: Simulations of Shared DNA for Genealogical Relationships.” (http://www.erinhillburns.com/wp-content/uploads/2019/09/Sim-cM_WhitePaper_Sep2019.pdf : accessed 10 October 2019).
4. “Autosomal DNA statistics,” International Society of Genetic Genealogy Wiki (https://isogg.org/wiki/Autosomal_DNA_statistics : accessed 11 October 2019), “Distribution of shared DNA for given relationships.”
5. Blaine Bettinger, “August 2017 Update to the Shared cM Project,” The Genetic Genealogist, 26 August 2017 (https://thegeneticgenealogist.com/2017/08/26/august-2017-update-to-the-shared-cm-project/ : accessed 11 October 2019). Figure 1 shows the average amount of DNA shared by second cousins (2C) is 233 cM, and this amount doubled is 466 cM.

Leave a comment